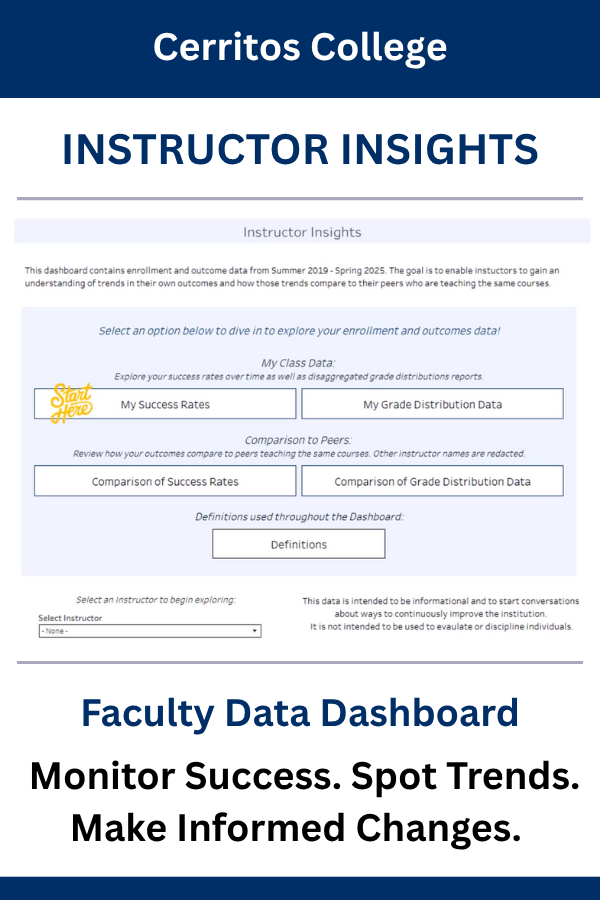
Instructor Insights - Data Dashboard For Faculty
The Instructor Insights dashboard is a tool just for faculty. It allows you to view your own course success rates and track how they change over time. You can also compare your results with overall course success rates in a particular course, giving you a clear picture of where your classes align with broader trends. The goal is to provide you with meaningful insights—supporting reflection, growth and strategies for student success.
How to Use Instructor Insights
Instructor Insights are designed for you to reflect on your own teaching and your students’ outcomes. Start by reviewing your course success rates. Look for patterns over time, or compare your results with the overall success rates for the same course across the college. Pay attention to courses where your students are doing well, as well as places where gaps or challenges appear.
As you review the data, ask yourself guiding questions:
- What might be contributing to these outcomes?
- How do my results align with broader trends in the course or department?
- Communicate with trusted colleagues about their approaches and strategies as you learn together.
- Are there assignments, teaching approaches or course structures that seem to make a difference?
Learn more about instructor insights
Video Tutorials
Receive step-by-step guidance on using Instructor Insights with our easy to follow video tutorials:
My Success Rates
Using Navigation & Filters
Attend a Professional Development Workshop
Join us for a session on Teaching with Insight: Using the Data Dashboards. An IERPG-led workshop designed to help faculty learn to navigate data dashboards, track success rates, and turn data into strategies that boost student achievement.
Visit Cornerstone to view upcoming sessions.
Continue exploring
Explore Cerritos College Data Dashboards to learn more about Enrollment, Learning Outcomes, Institutional Health, and more.
Stay Connected